Right-sizing a Kubernetes cluster without overspending
Most Kubernetes bills are not a Kubernetes problem. A practical method for sizing nodes, setting requests and limits, and knowing when to scale out.
Most teams arrive at Kubernetes from a handful of VMs, pick node sizes that feel safe, and then spend the next year paying for headroom they never use. The cluster is not expensive because Kubernetes is expensive. It is expensive because nobody ever measured what the workloads actually need.
Here is the method we use with customers migrating onto managed Kubernetes, in the order we use it.
1. Measure before you size
Run the workload somewhere — anywhere — for a week under realistic traffic. You need two numbers per container: the p95 of CPU usage and the p95 of working-set memory. Not the average, and not the peak. The average under-provisions you into throttling; the peak makes you buy a cluster for a once-a-month batch job.
If the workload is already on Kubernetes, the numbers are one query away:
kubectl top pods --all-namespaces --sort-by=memory

# or, with metrics in Prometheus:
quantile_over_time(0.95,
  rate(container_cpu_usage_seconds_total{namespace="prod"}[5m])[7d:5m]
)
Write the numbers down per deployment. This table is the entire basis of the sizing decision, and it is the artefact most teams skip.
2. Set requests from measurement, limits from tolerance
Requests are a scheduling contract: they decide how much of the node the scheduler reserves for you, and therefore how many pods fit. Limits are a blast radius: they decide what happens when something misbehaves.
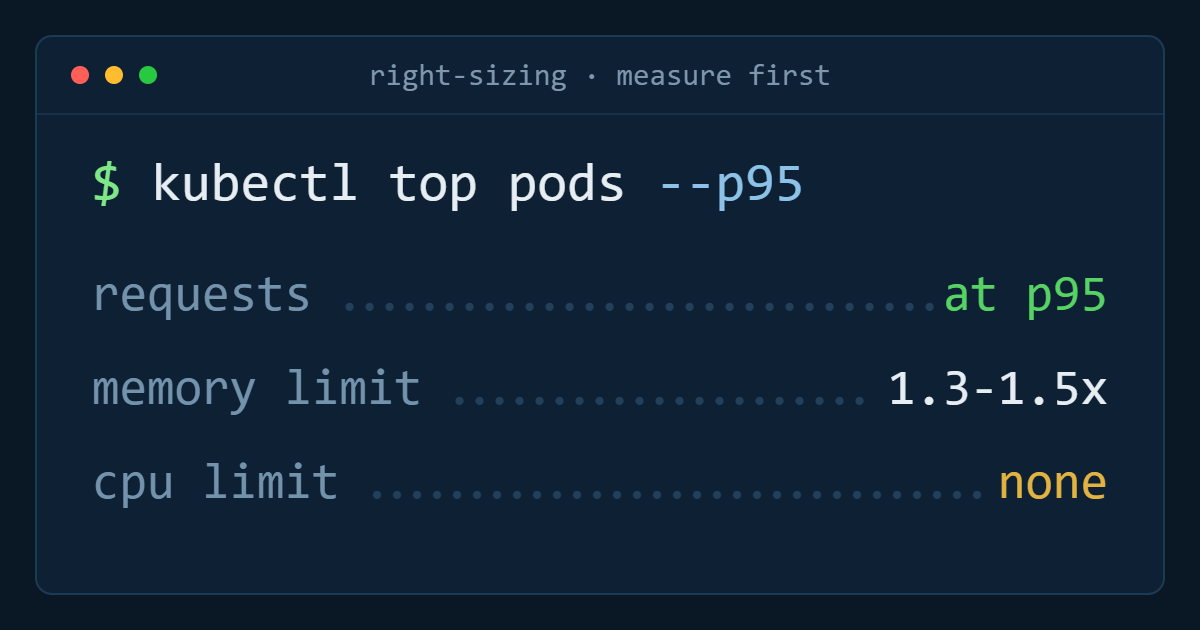
Set the CPU request at roughly the p95 you measured, and do not set a CPU limit at all unless you have a specific noisy-neighbour problem. CPU is compressible — a pod over its share gets throttled by the scheduler anyway, and hard CPU limits mostly manufacture latency spikes in services that were doing nothing wrong.
Memory is the opposite. It is not compressible, so set the request at p95 and the limit around 1.3 to 1.5 times that. Above the limit the pod gets killed, which is the correct outcome for a leak and a disaster for an under-sized request.
resources:
  requests:
    cpu: 250m
    memory: 512Mi
  limits:
    memory: 768Mi
3. Choose node size from pod shape, not from instinct
Add up the requests of everything that has to run, then divide by candidate node sizes and look at the remainder. A cluster of 4 vCPU / 8 GB nodes running pods that request 1.5 GB each wastes nearly a gigabyte per node to rounding. The same workload on 8 vCPU / 16 GB nodes fits ten pods with almost nothing left over.
Two constraints pull in opposite directions. Bigger nodes pack better and cost less per unit of capacity. Smaller nodes fail smaller — losing one node takes out a smaller share of your capacity, and scaling steps are finer. For most production workloads the sweet spot is nodes that hold between six and twelve of your typical pod, across at least three nodes.
Also budget for the system: kubelet, CNI, CSI drivers, log shippers and metrics agents will take 0.5 to 1 vCPU and around 1 GB per node before a single one of your containers starts. On a 2 vCPU node that is a quarter of the machine.
4. Leave exactly one node of headroom
The common failure is a cluster sized so tightly that losing one node cannot be absorbed, so the first hardware event turns into a partial outage. The common overreaction is 50% idle capacity "to be safe".
The rule that survives contact with reality: size so that the cluster can lose one node and still schedule everything, and let the autoscaler handle the rest. With three nodes that is 33% headroom, which sounds expensive. With eight nodes it is 12%, which is cheap. This is the strongest argument for consolidating small clusters.
5. Scale out on the right signal
Horizontal pod autoscaling on CPU is the default and it is usually the wrong signal. Most user-facing services are not CPU-bound — they are waiting on a database or an upstream API, and CPU stays flat while latency climbs. Scale on the thing your users actually feel: queue depth for workers, requests-in-flight or p95 latency for APIs.
apiVersion: autoscaling/v2
kind: HorizontalPodAutoscaler
spec:
  metrics:
    - type: Pods
      pods:
        metric:
          name: http_requests_in_flight
        target:
          type: AverageValue
          averageValue: "30"
6. Revisit quarterly, not never
Sizing is not a one-off. Deployments accumulate: someone doubles a memory request to fix an incident at 2am and nobody halves it again when the real bug is fixed. Once a quarter, pull the p95 numbers again and compare them to what is in the manifests. In most clusters we look at, that single pass finds 20 to 30% of allocated memory that no workload has touched in months.
The short version
Measure p95 per container. Requests at p95, memory limit 1.3 to 1.5 times, no CPU limit. Pick node sizes that your pods divide into cleanly. Keep one node of headroom. Autoscale on a signal your users can feel. Re-measure every quarter.
None of this is Kubernetes-specific cleverness. It is the same capacity planning that ran fleets of physical servers, applied to a scheduler that will happily let you waste money at a much finer granularity.
Antyxsoft Cloud
Written by the engineers who operate the Antyxsoft platform.